

The hardest part of learning data science is not the code. It is finding data worth analysing. Textbook examples are too clean to teach anything, and real-world data is too messy to start with. The ten datasets below sit in between: real enough to teach real skills, clean enough to be approachable.
Each one is free, well-documented, and has been used in enough tutorials that you can find help when you get stuck.
How to Use a Dataset Well
Do not open a notebook and start plotting. Start with three questions you want to answer, written down before you look at the data. This prevents the most common beginner mistake, which is producing charts that answer nothing.
The second discipline is to write up what you found, in plain language, for someone who has not seen the data. Analysis that cannot be explained is analysis that has not been understood.
The Top 10 Datasets
1. Titanic Passenger Data
The classic beginner dataset. Passenger details and survival outcomes. Teaches cleaning, feature engineering, and classification in one small file.
Overused, but still the best place to learn the workflow.
2. Iris Flower Measurements
Fifty samples of three species, four measurements each. The hello-world of clustering and classification.
Small enough to understand completely, which is rare and valuable.
3. Boston Housing Prices
House prices with neighbourhood features. Teaches regression and the problem of correlated features.
Old and well-studied, which means you can check your work against published analyses.
4. MNIST Handwritten Digits
Seventy thousand images of handwritten digits. The standard introduction to image classification and neural networks.
Large enough to need efficient code, small enough to run on a laptop.
5. MovieLens Ratings
User ratings of films. Teaches recommendation systems, sparse matrices, and collaborative filtering.
The small version is manageable; the full version is a real engineering challenge.
6. COVID-19 Case Data
Daily case and death counts by country and region. Teaches time series, missing data, and the dangers of comparing regions with different testing rates.
A good dataset for learning that data quality matters more than model choice.
7. Superstore Sales
Retail transactions with categories, regions, and profit. Teaches aggregation, grouping, and the difference between revenue and profit.
Business-relevant, which makes the analysis feel purposeful.
8. Air Quality Measurements
Pollutant levels across cities and time. Teaches handling missing values, time series decomposition, and combining datasets.
Real-world messy, which is the point.
9. World Bank Development Indicators
Country-level economic and social statistics over decades. Teaches merging, reshaping, and the limits of cross-country comparison.
Free, comprehensive, and underused by beginners.
10. Spotify Tracks Dataset
Audio features of thousands of songs. Teaches clustering, dimensionality reduction, and the challenge of interpreting unsupervised results.
Fun to explore, which keeps motivation high.
Where to Find More
Kaggle hosts thousands of datasets with community notebooks showing how others approached them. UCI Machine Learning Repository is the original academic source. Government open-data portals are underused and often the most interesting.
The best dataset is one you care about enough to spend a weekend on. Pick by interest, not by difficulty.
Common Mistakes When Learning With Data
Starting with a model before exploring the data is the first. You cannot choose an appropriate model without understanding what the data looks like, and exploration takes a fraction of the time modelling does.
Ignoring missing values is the second. Real datasets have gaps, and how you handle them affects every result downstream. Dropping rows is easy and often wrong.
Overfitting a small dataset is the third. A model that memorises a hundred rows has learned nothing, and the test set will show it. Always hold out data you do not train on.
And presenting results without uncertainty is the fourth. A number without a confidence interval or a caveat is a claim, not a finding.
Building a Portfolio With Data
Three analyses, well-documented, beat thirty notebooks that nobody can follow. The standard for a portfolio piece is: a clear question, a reproducible method, a result, and a limitation. All four, in plain language.
Host the work publicly. A GitHub repository with a README explaining the project is the minimum. A short blog post summarising the finding is better.
And choose datasets that relate to something you know. An analysis of cricket statistics by someone who follows cricket is more convincing than the same analysis by someone who does not, because the domain knowledge shows in the questions asked.
How to Document Your Analysis
A notebook full of charts with no explanation is not a portfolio piece. It is a pile of output. The difference is documentation: a clear statement of what you asked, what you found, and what you would do next.
Write the README before you start analysing. State the question, the data source, and the method you plan to use. This forces clarity and gives you something to check your result against.
Then write a short summary at the end, in plain language, for someone who has not seen the data. If you cannot explain the finding in three sentences, you do not understand it yet.
And include the limitations. Every analysis has them, and stating them honestly is what separates a serious piece of work from a confident one.
The Bottom Line
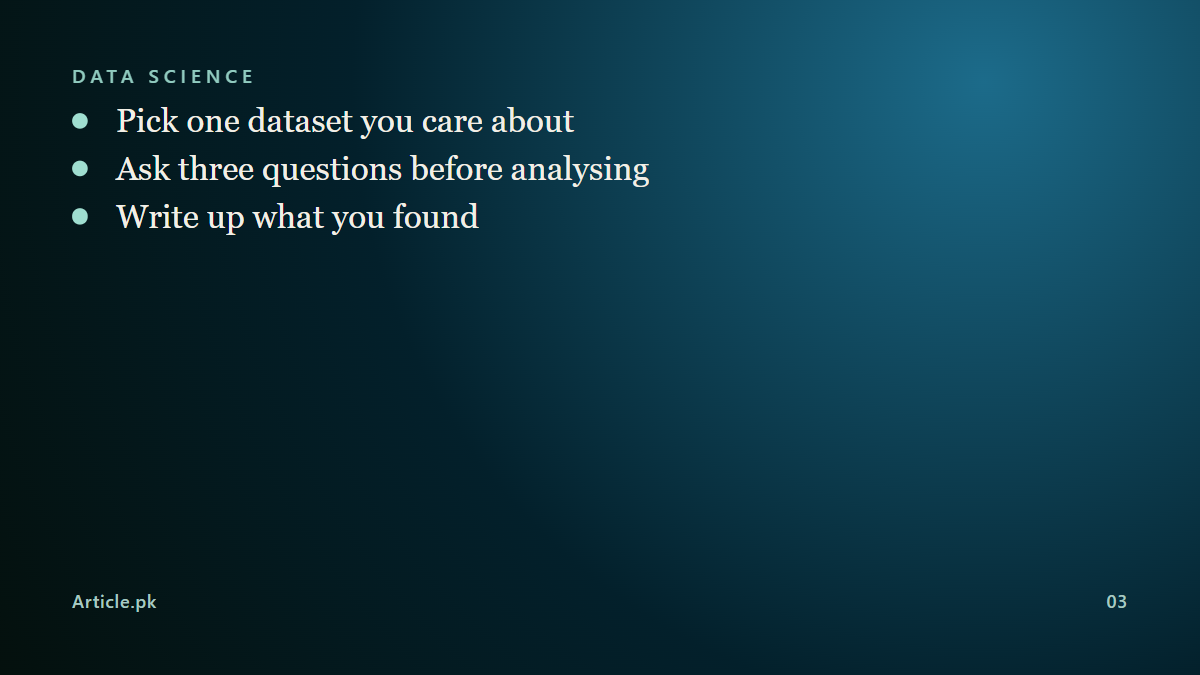
Pick one dataset you care about, ask three questions before opening a notebook, and write up what you found. That is a portfolio piece.
One final piece of advice: do not wait until you feel ready to publish your work. The analysis that is eighty percent polished and public teaches you more than the one that is a hundred percent polished and private. Feedback from readers is the fastest way to improve, and it only arrives after you share.
It is also worth keeping a running list of questions that occur to you while analysing. Most of them will not be answerable with the current data, but they are the seeds of the next project. The analysts who produce consistently good work are not the ones with the best technique; they are the ones with the best questions, and questions come from curiosity about the data rather than from the tools.










Comments 0
Sign in to join the conversation.
No comments yet. Be the first to say something.